Ka riro mai nei mātau ā mātou pūtea i te Karauna We receive all our funding from the Crown
Full details of spending in 2020/21 can be found in the Financial Statements.
NZ Superannuation
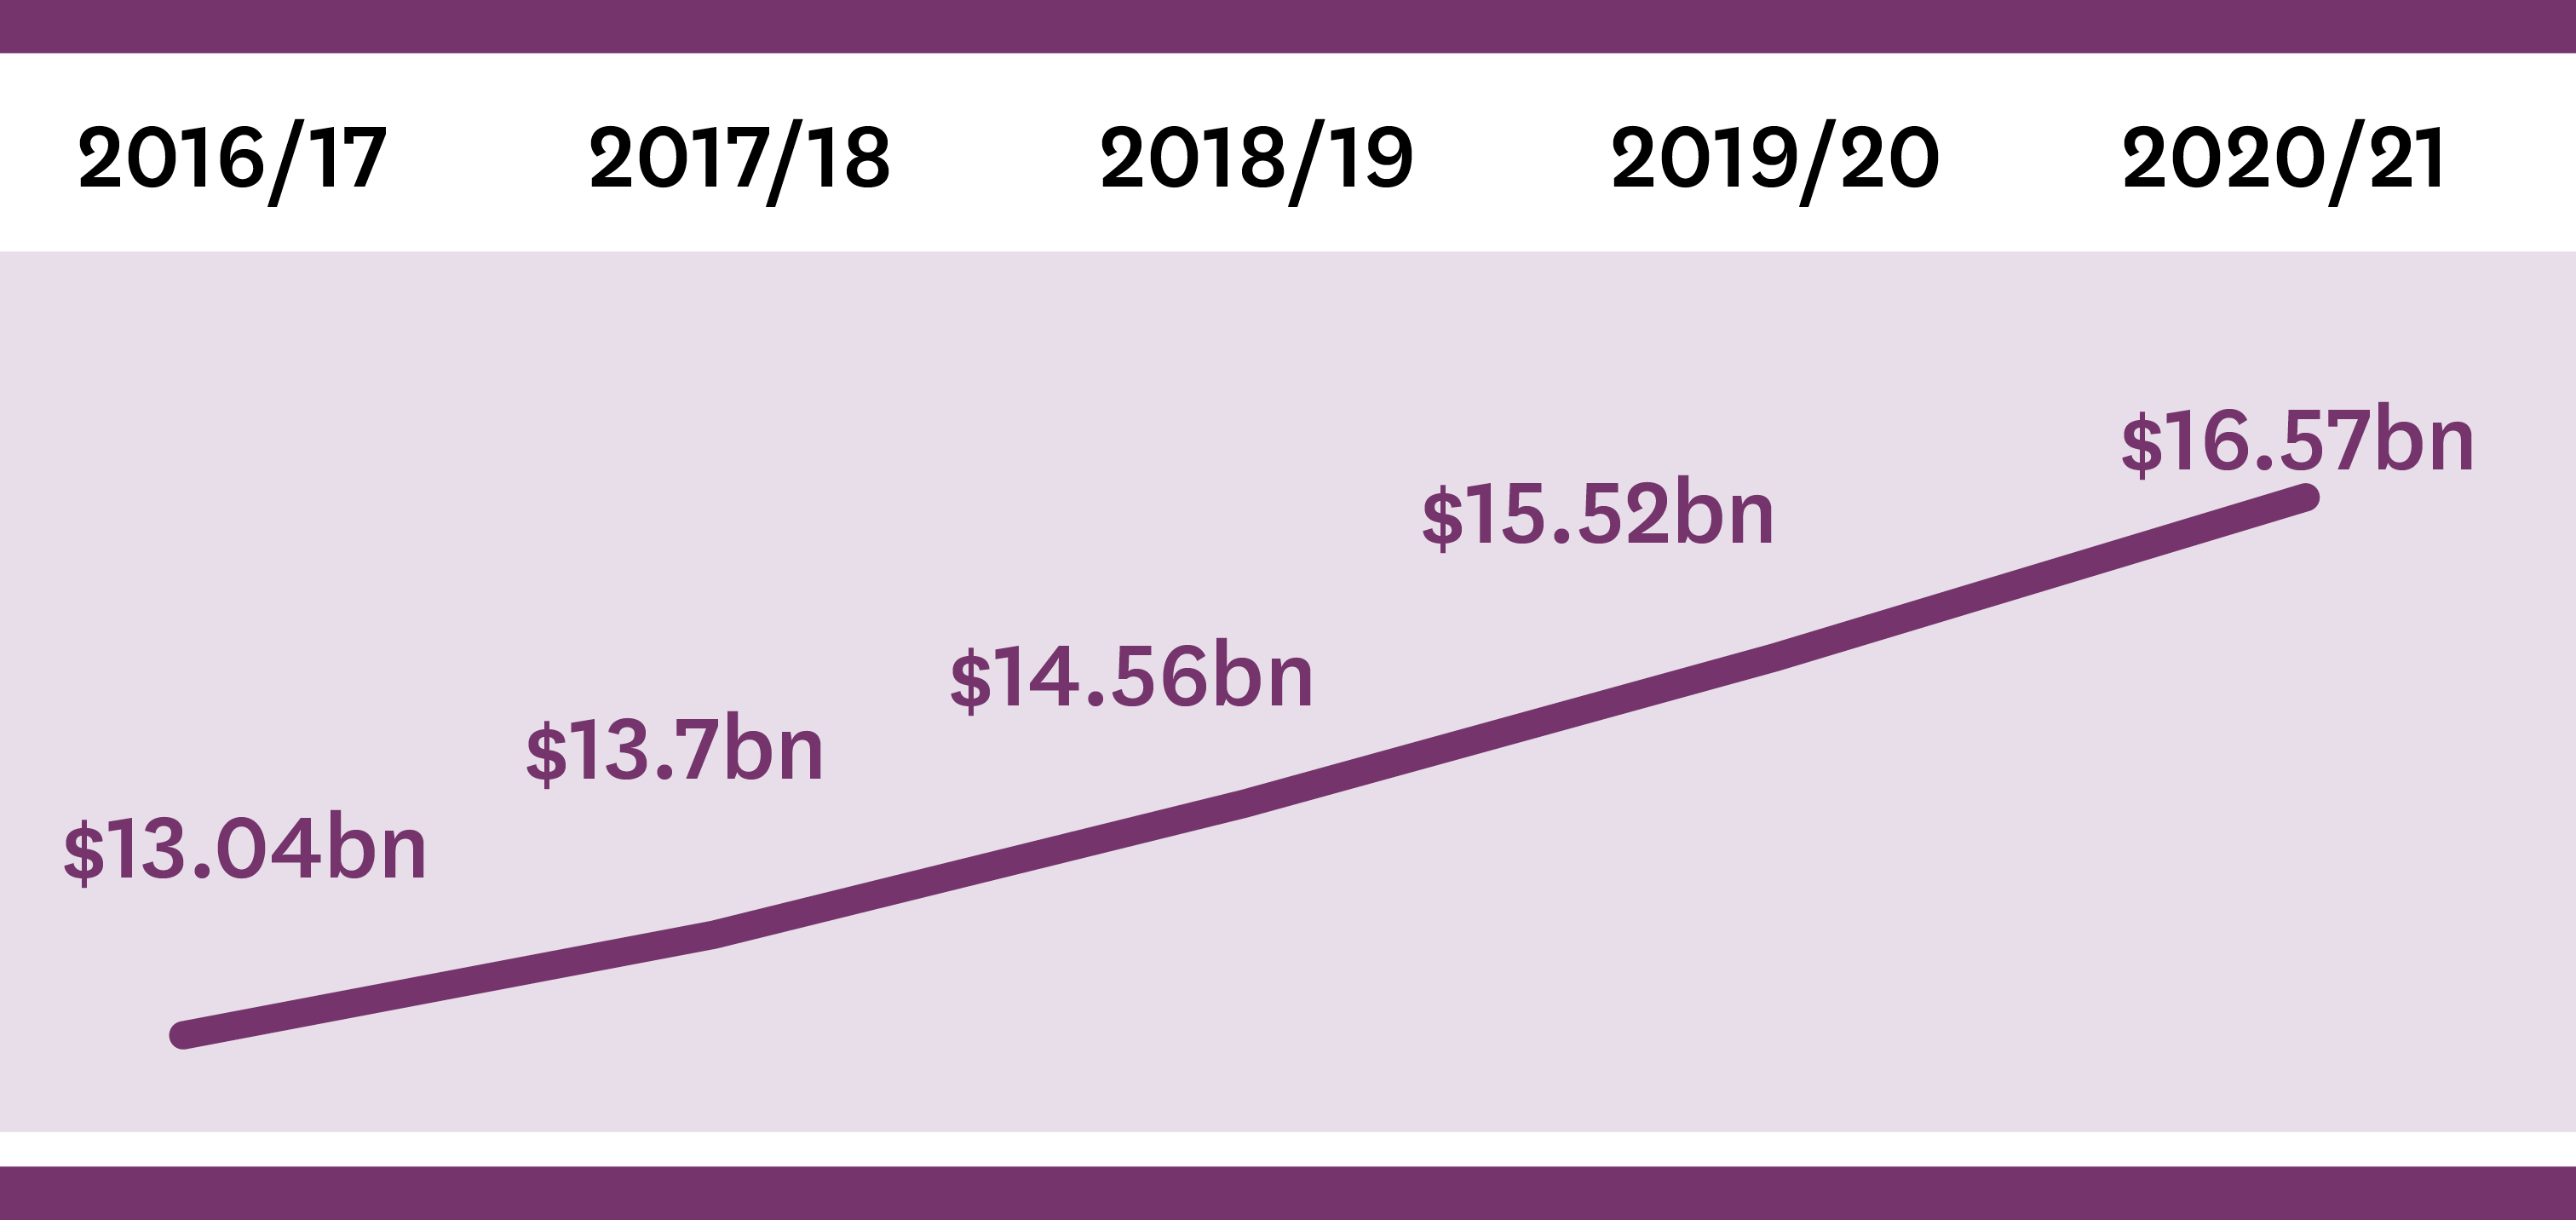 This graph shows how much MSD spent on supperannuation each year from the 2016/17 financial year to the 2020/21 financial year. The upwards trend shows that the amount spent each year has been increasing. The spend on supperannuation in each finacial year was: in 2016/2017 $13.04 billion, in 2017/18 $13.7 billion, in 2018/19 $14.56 billion, in 2019/20 $15.52 billion, and in 2020/21 $16.57 billion.
COVID-19 wage subsidies
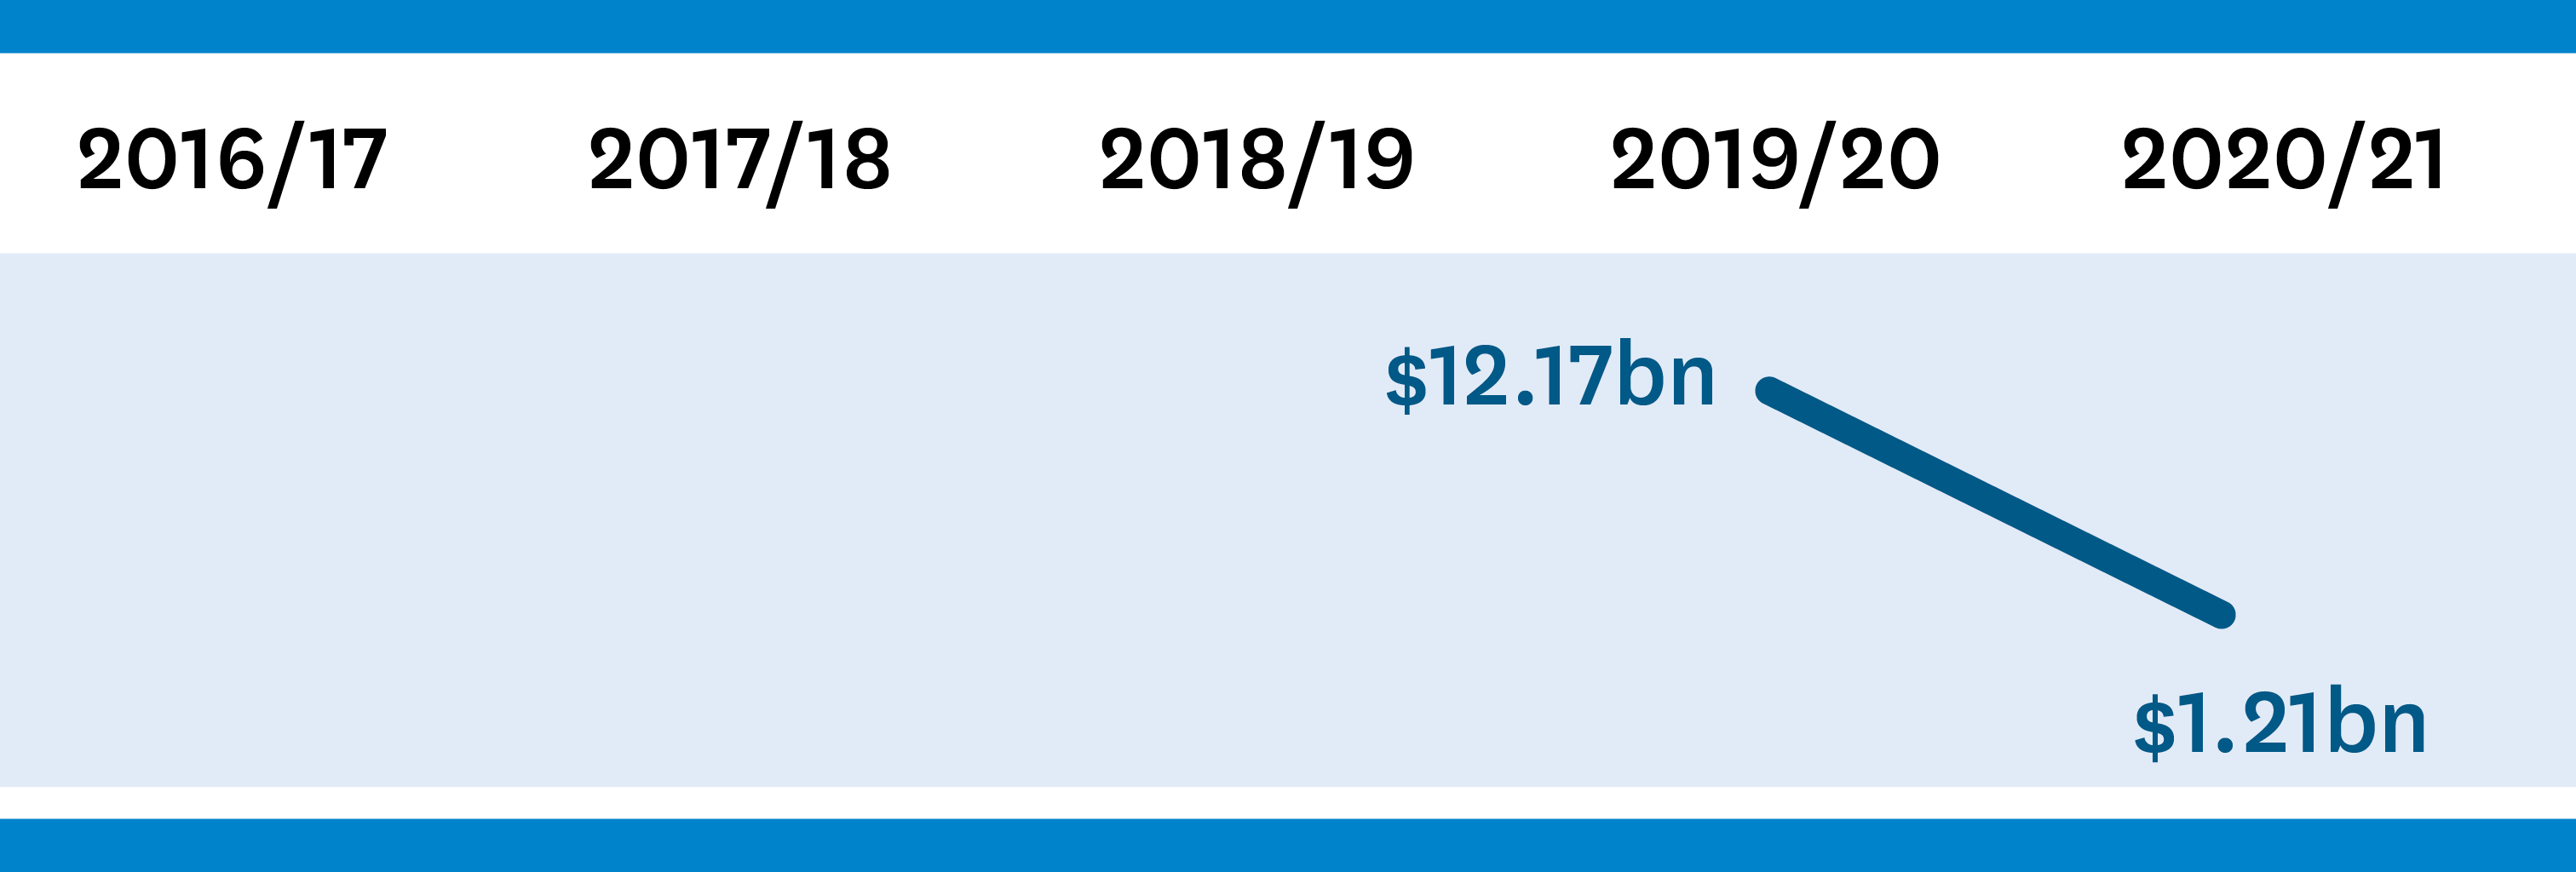
This graph shows how much MSD spent on COVID-19 wage subsidies each year from the 2016/17 financial year to the 2020/21 financial year. The amount spent is shown for the 2019/20 and 2020/21 financial years only, because the wage subsidy scheme was only active in those two years. The trend is downwards. The spend on COVID-19 wage subsidies in each finacial year was: in 2019/20 $12.17 billion, and in 2020/21 $1.21 billion.
Other assistances and benefits

This graph shows how much MSD spent on other assistance and benefits each year from the 2016/17 financial year to the 2020/21 financial year. The trend is upwards from the 2017/18 year, which shows that the amount spent each year has been increasing since then. The spend on other assistance and benefits in each financial year was: in 2016/17 $6.27 billion, in 2017/18 $5.91 billion, in 2018/19 $6.57 billion, in 2019/20 $7.84 billion, and in 2020/21 $9.07 billion.
Housing assistance and rent subsidies
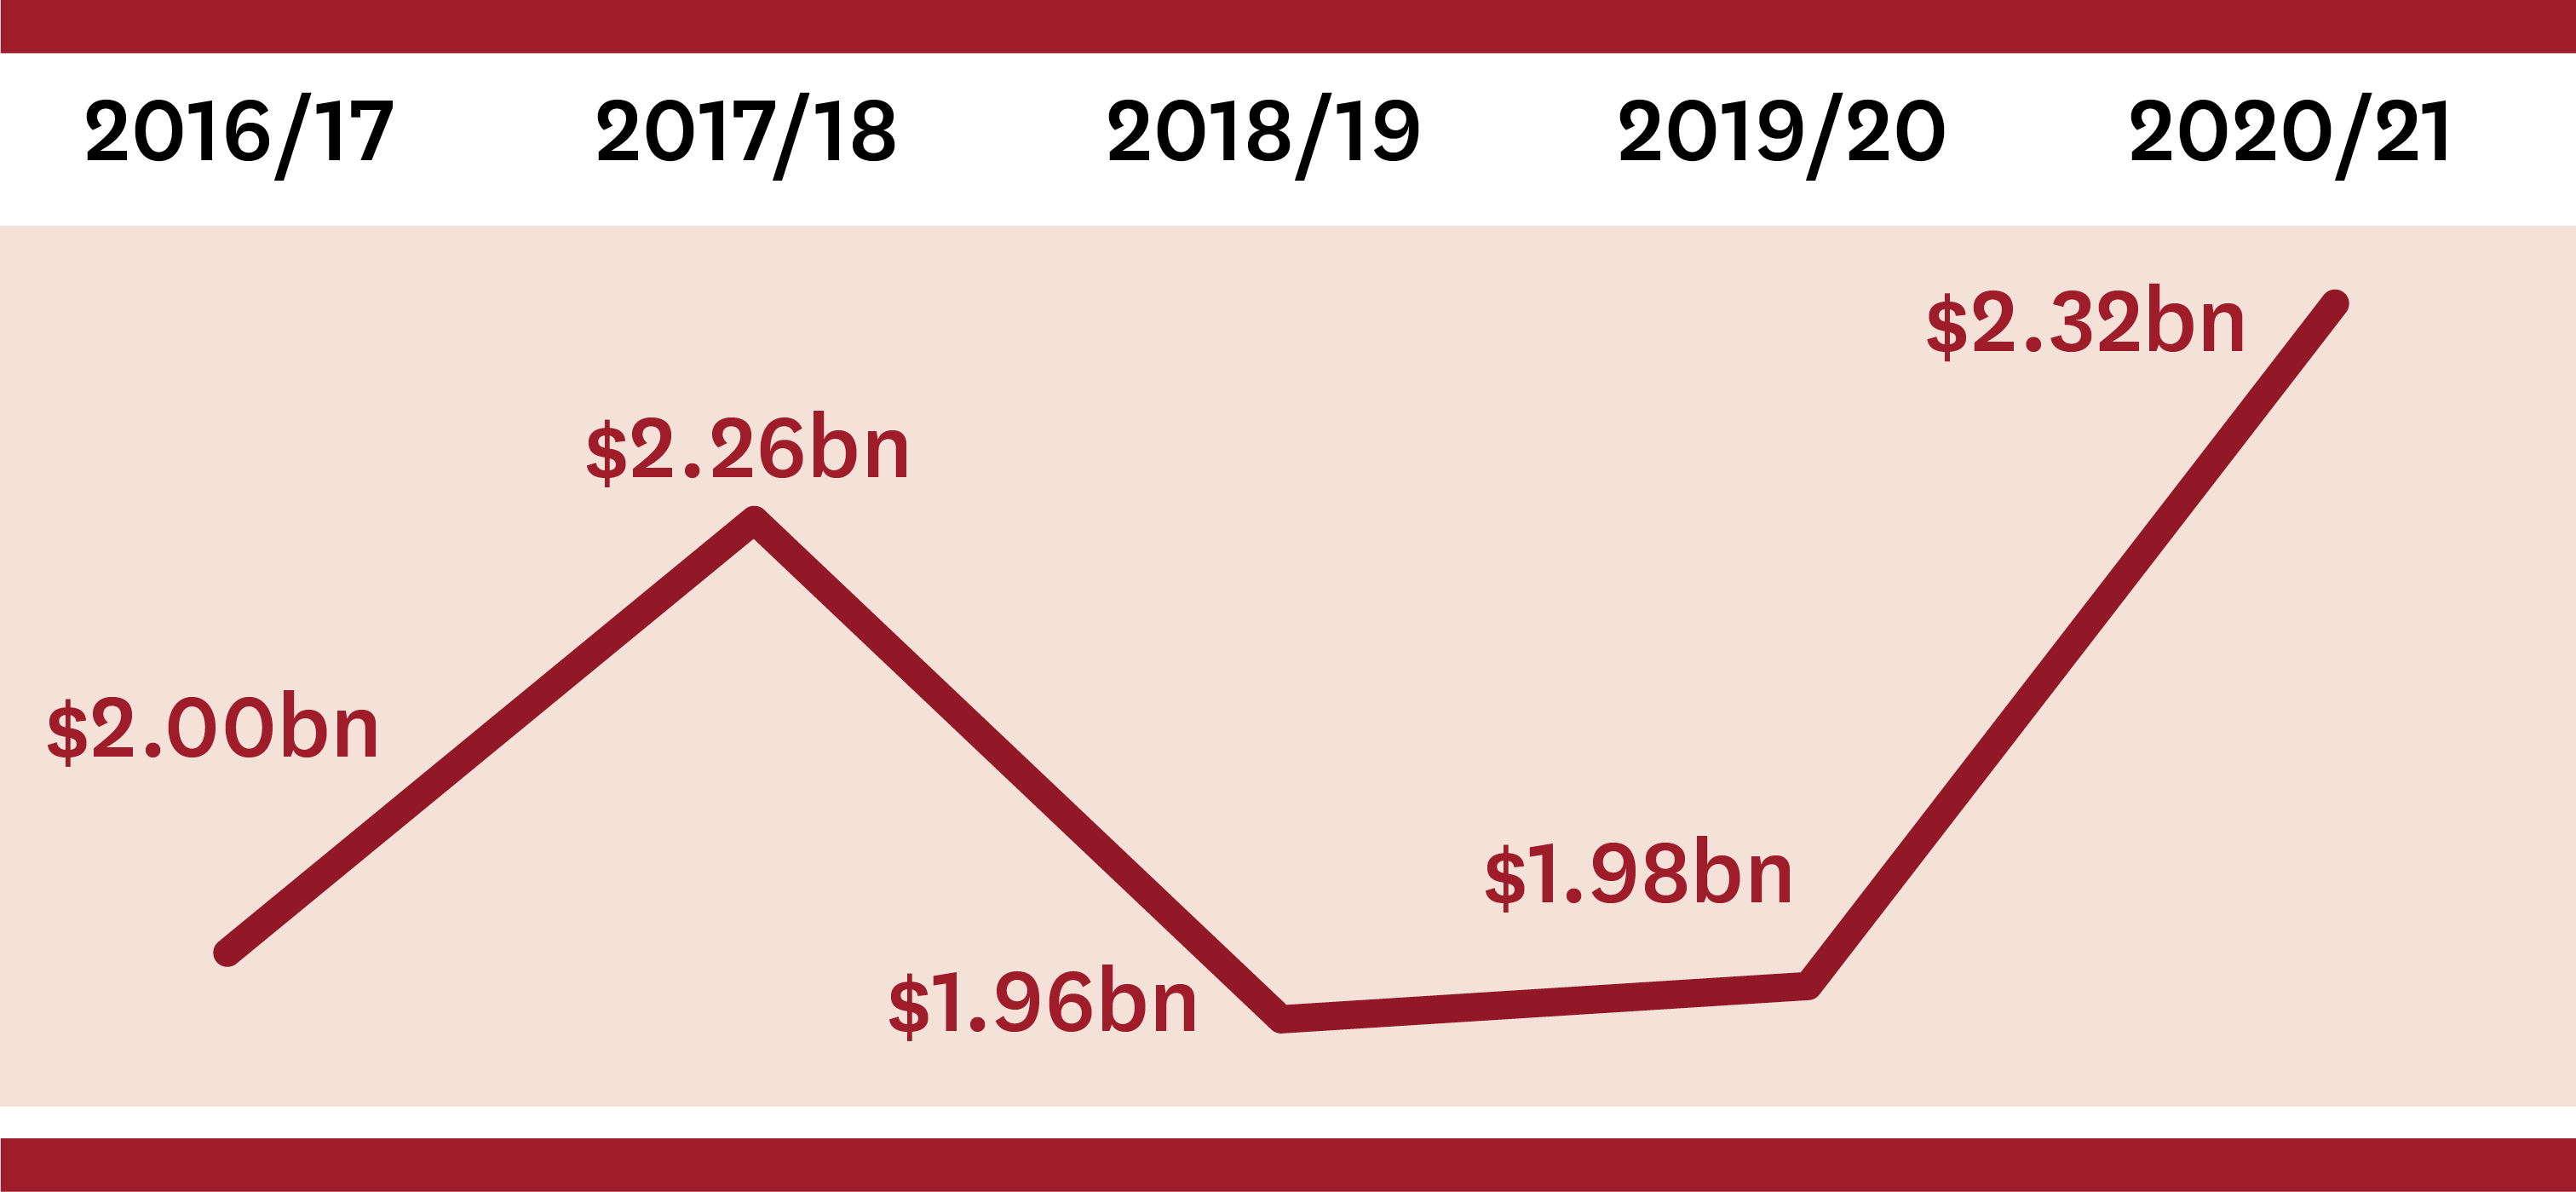
This graph shows how much MSD spent on housing assistance and rent subsidies each year from the 2016/17 financial year to the 2020/21 financial year. The upwards and downwards movement shows there was no trend in spending across the five years reported. The spend on housing assistance and rent subsidies in each financial year was: in 2016/17 $2.00 billion, in 2017/18 $2.26 billion, in 2018/19 $1.96 billion, in 2019/20 $1.98 billion, and in 2020/21 $2.32 billion.
Student support
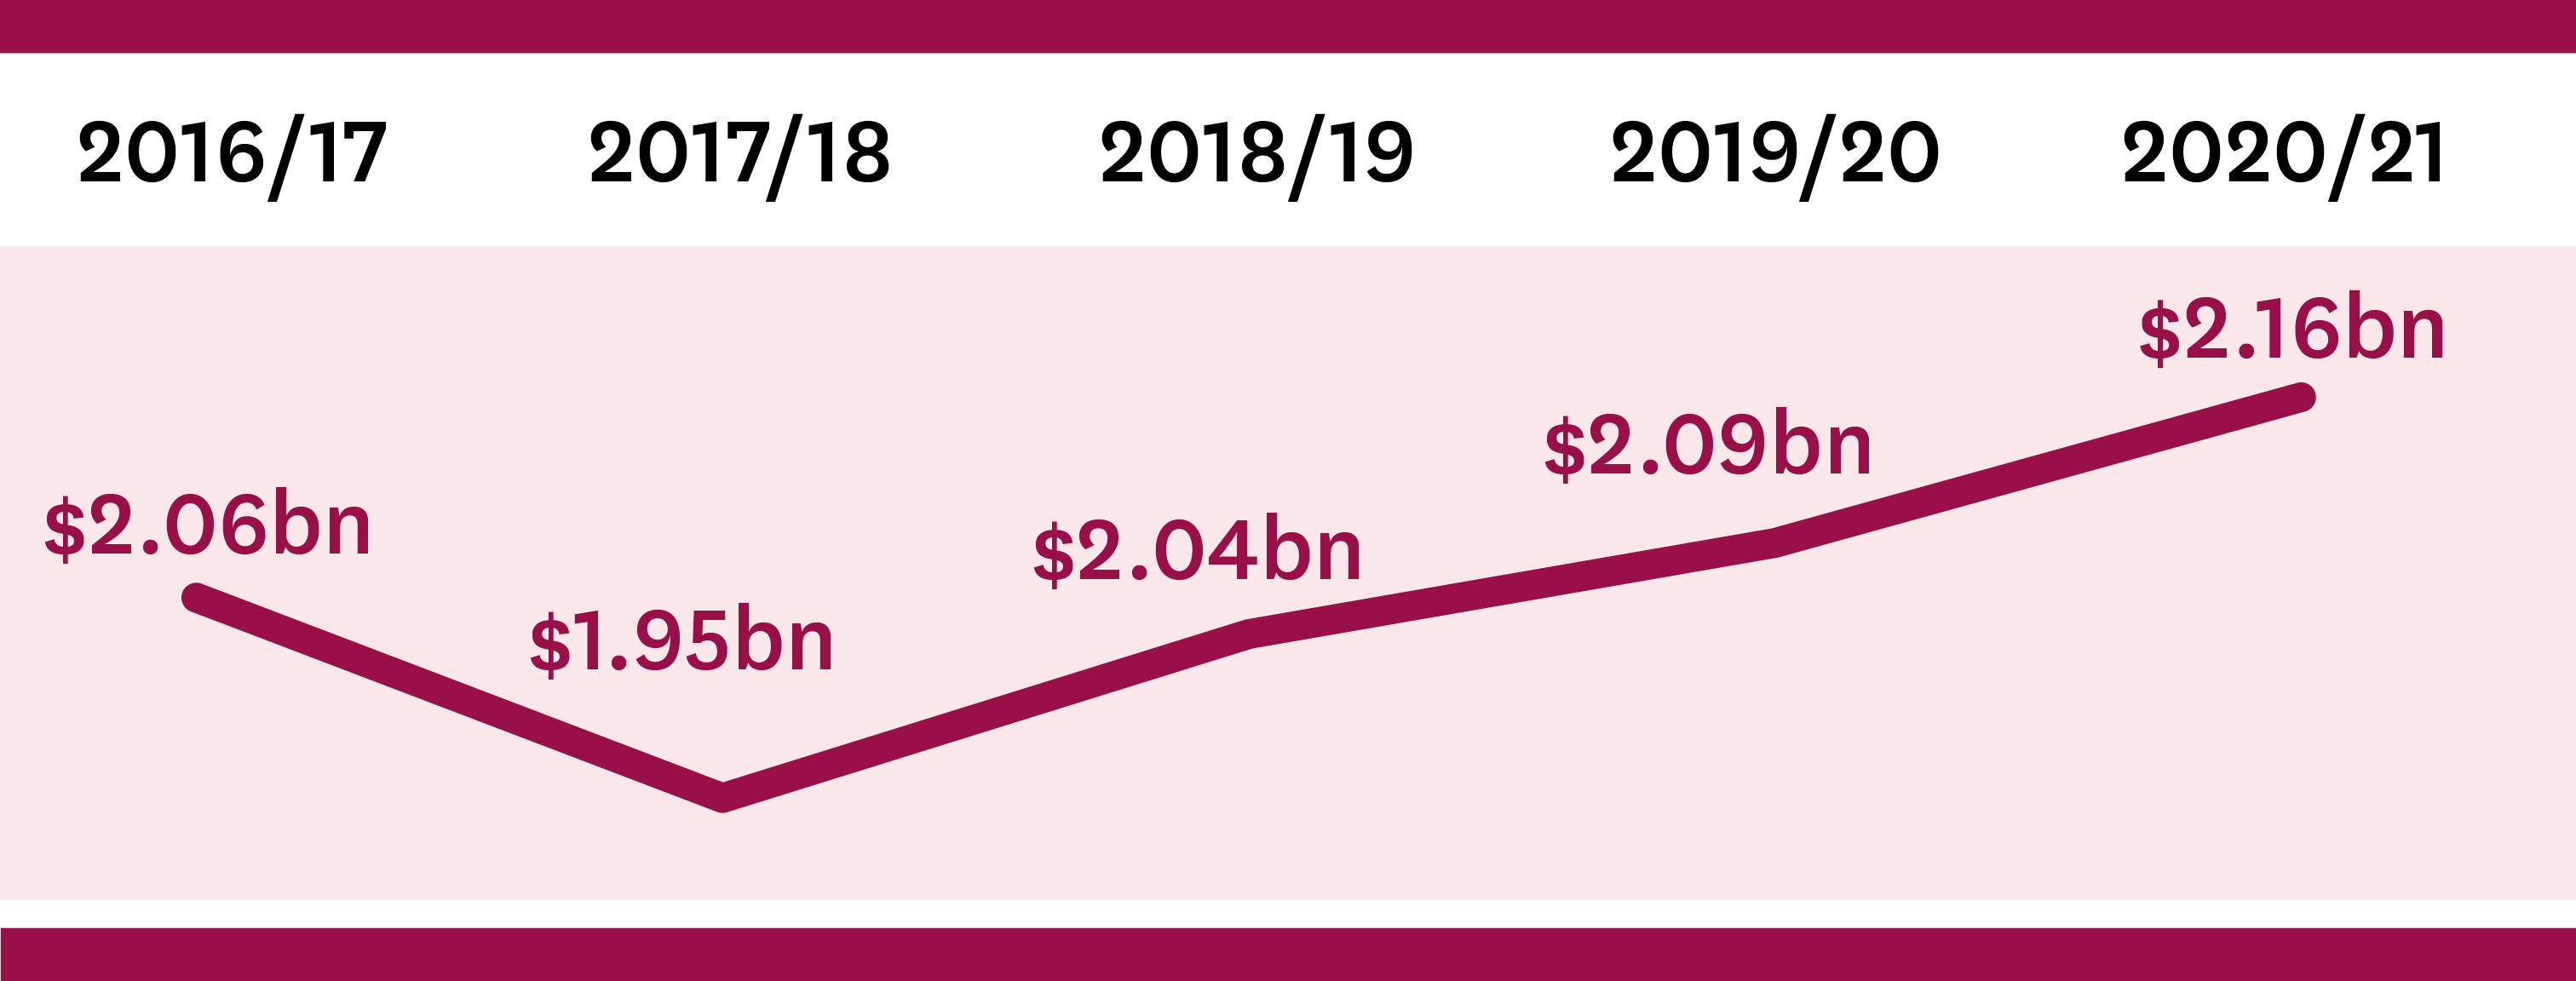
This graph shows how much MSD spent on student support each year from the 2016/17 financial year to the 2020/21 financial year. The trend is upwards from the 2017/18 year, which shows that the amount spent each year has been increasing since then. The spend on student support in each finacial year was: in 2016/17 $2.06 billion, in 2017/18 $1.95 billion, in 2018/19 $2.04 billion, in 2019/20 $2.09 billion, and in 2020/21 $2.16 billion.
Departmental operating costs
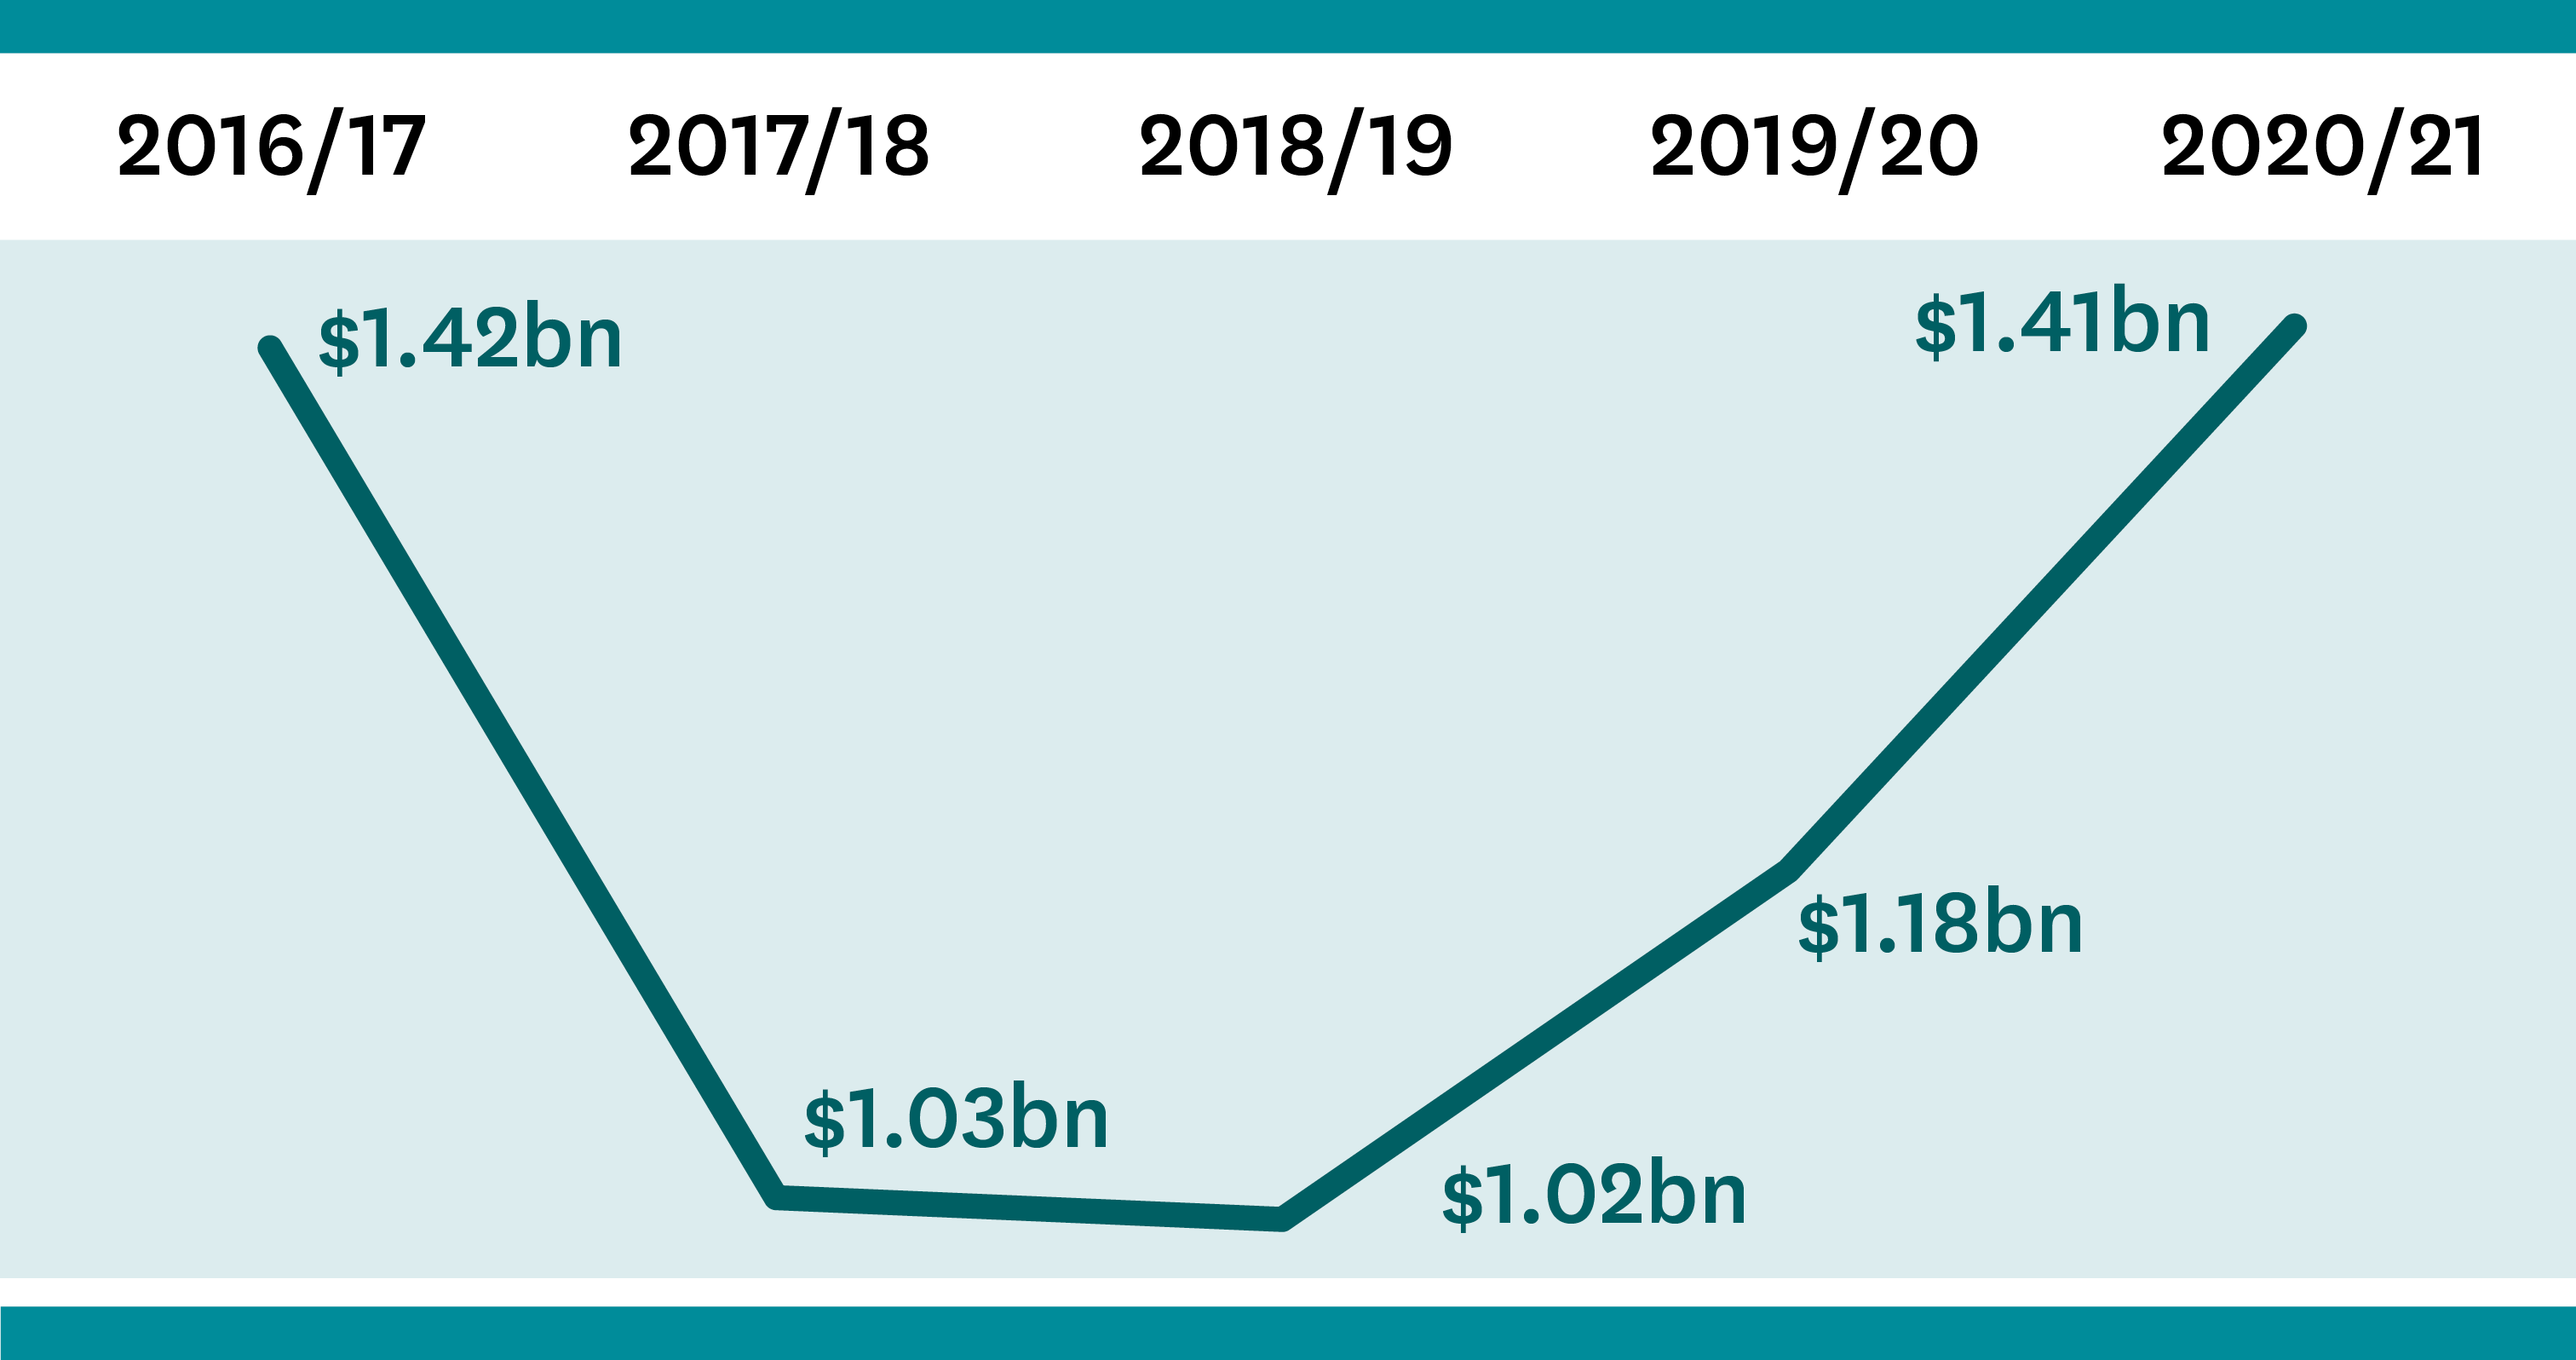
This graph shows how much MSD spent on departmental operating costs each year from the 2016/17 financial year to the 2020/21 financial year. The trend is downwards from 2016/17 to 2018/19, and then upwards for 2019/20 and 2020/21. The spend on departmental operating costs in each financial year was: in 2016/17 $1.42 billion , in 2017/18 $1.03 billion, in 2018/19 $1.02 billion , in 2019/20 $1.18 billion, and in 2020/21 $1.41 billion.
Total
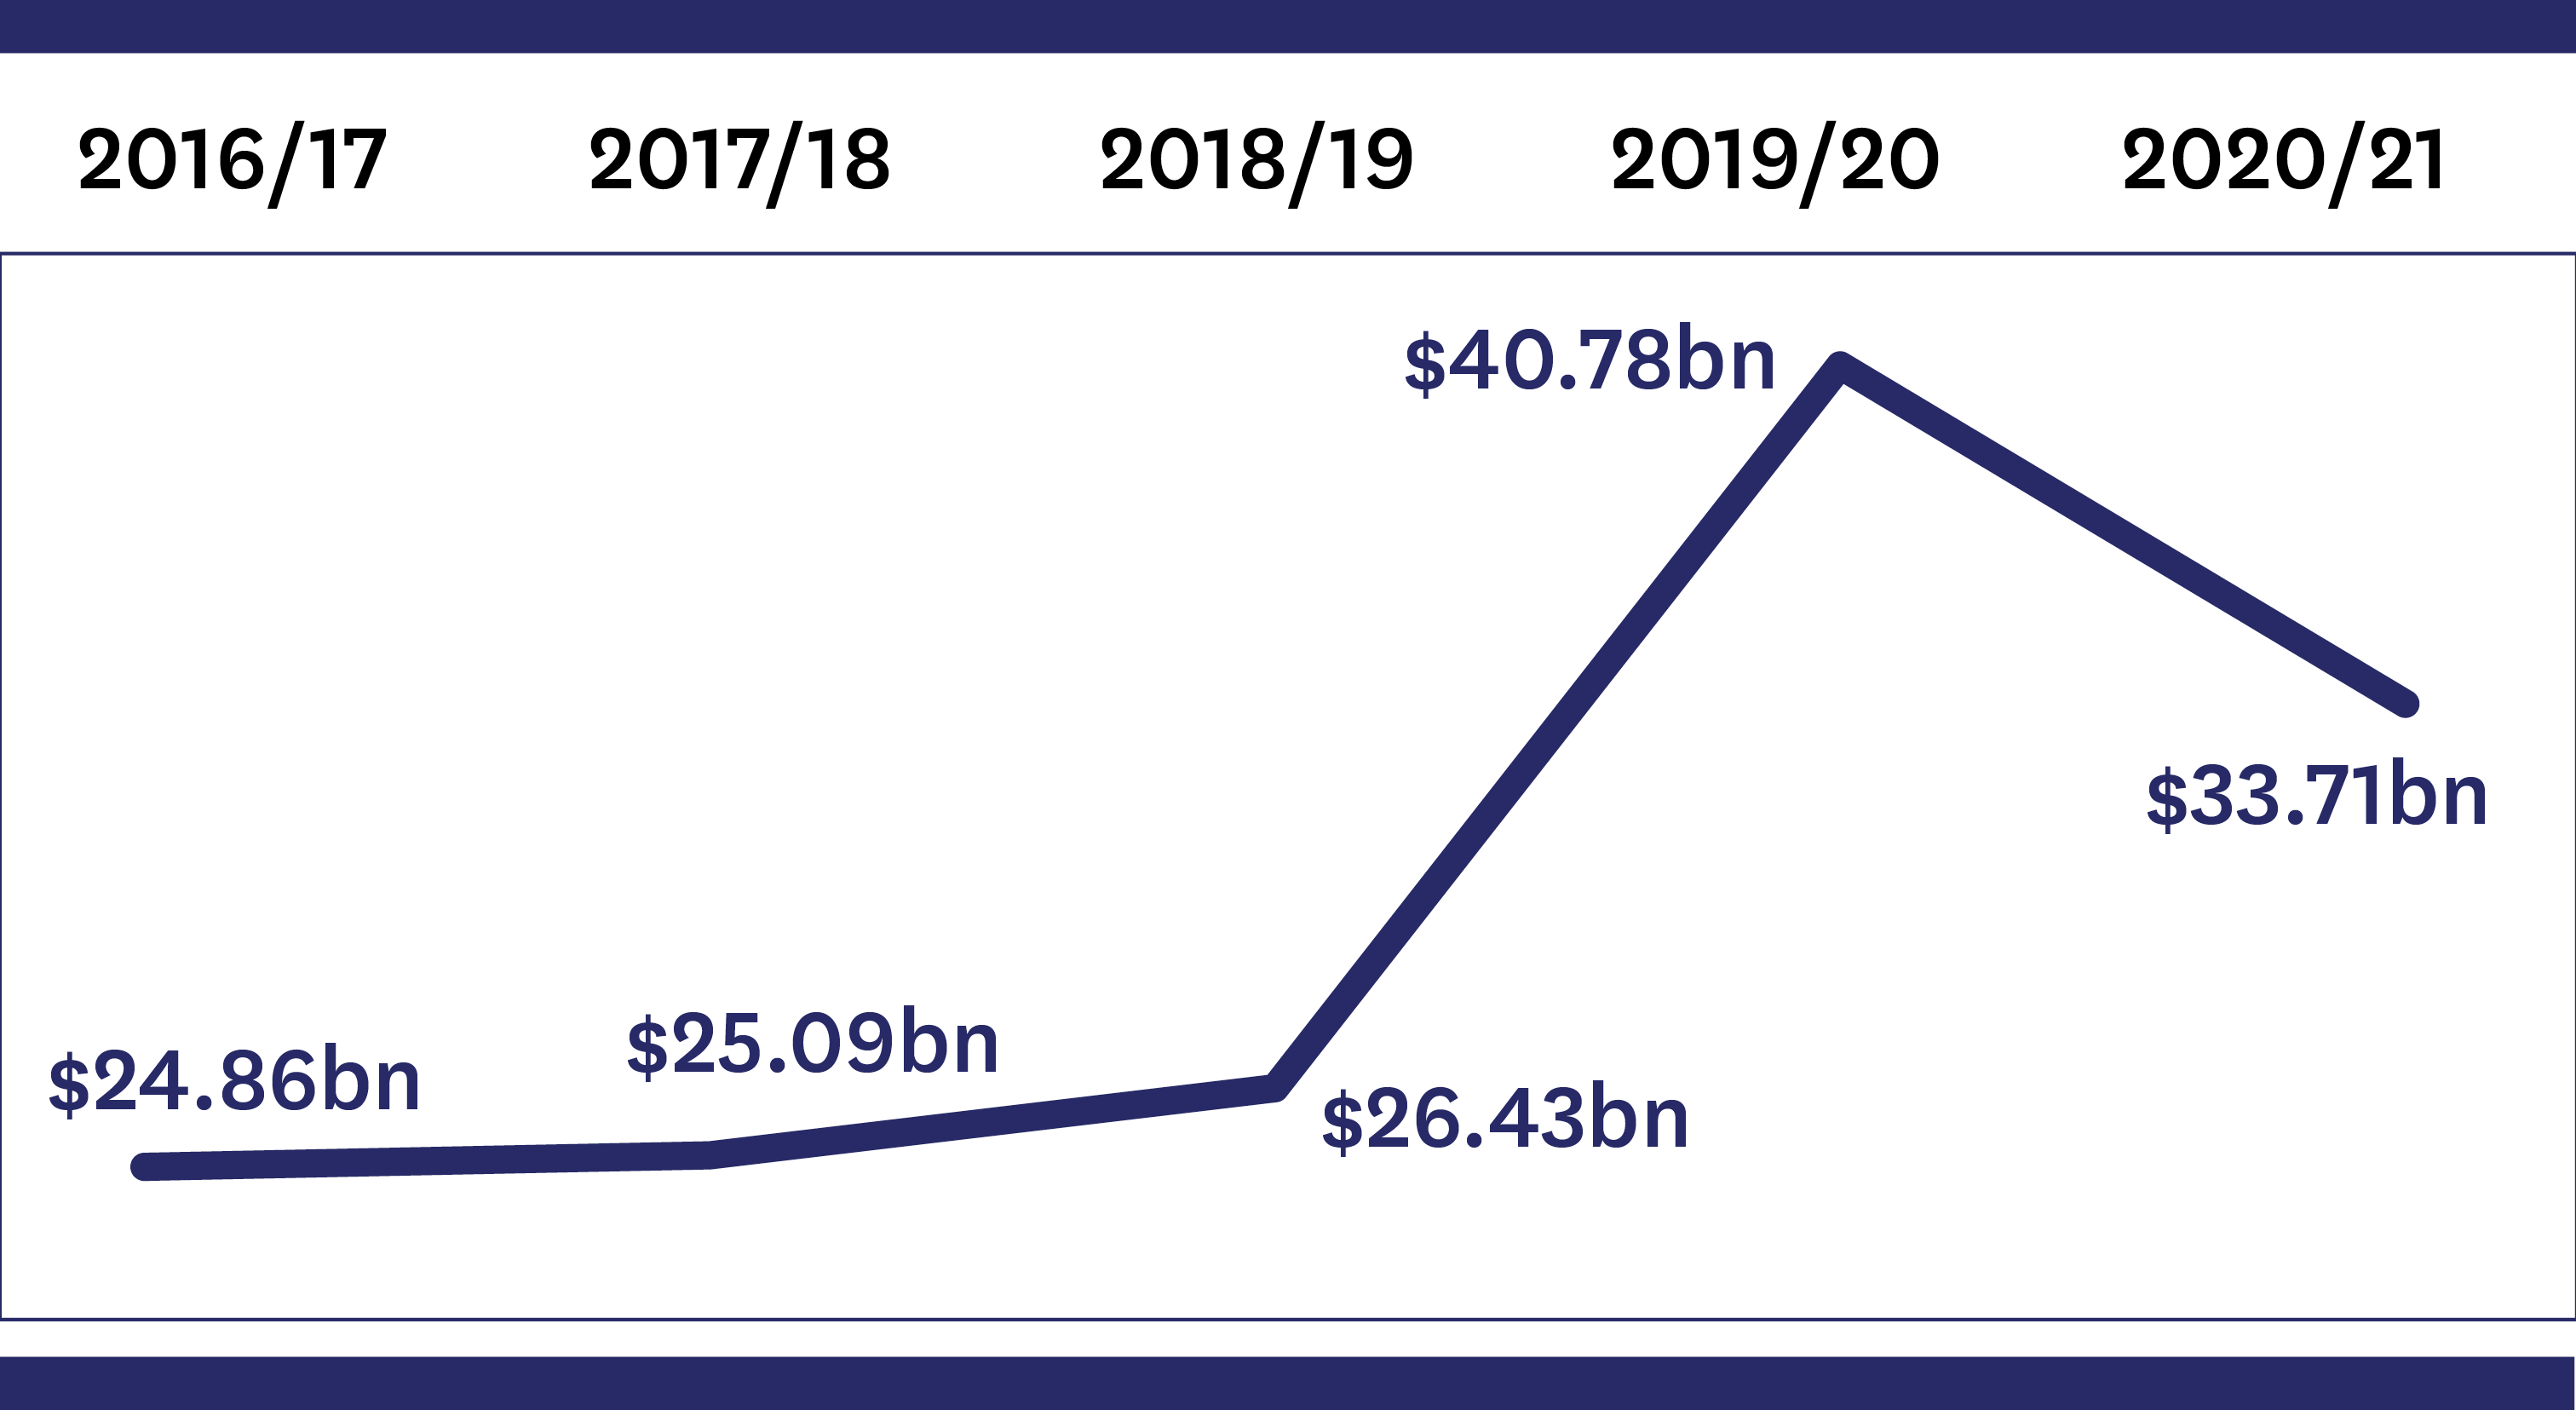 This graph shows how much MSD spent in total each year from the 2016/17 financial year to the 2020/21 financial year. The upwards trend shows that the amount spent each year has been increasing, with a sharp increase in 2019/20 (due to COVID-19). The total spend in each finacial year was: in 2016/17 $24.86 billion, in 2017/18 $25.09 billion, in 2018/19 $26.43 billion, in 2019/20 $40.78 billion, and in 2020/21 $33.71 billion.
Footnotes
Departmental operating costs prior to 1 April 2017, when Oranga Tamariki was established, include Child, Youth and Family.
Departmental operating costs prior to 1 October 2018, when the Ministry of Housing and Urban Development was established, include policy advice provided by MSD on emergency, transitional and public housing.
The key categories of spending do not necessarily add up to the total spend in each year as some small spending categories are not shown in this chart.